Map: Indian States by GST Collection (FY 2023-24)
See Indian states ranked by GST collection in 2023-24. Discover top contributors, surprising trends, and key insights into state economies.
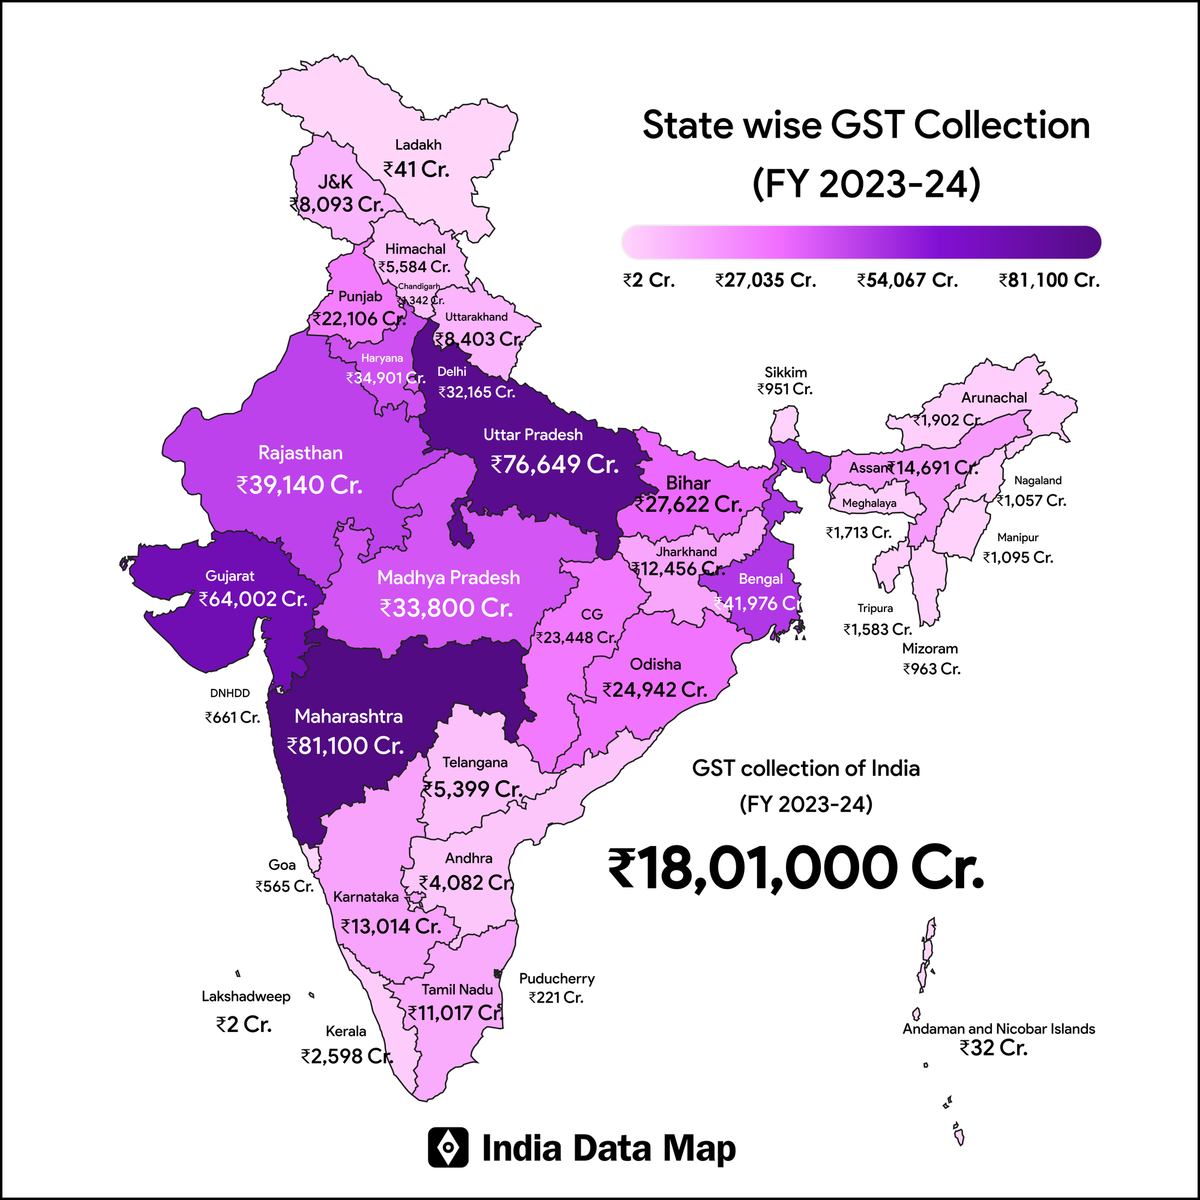
The Goods and Services Tax (GST) represents one of the most significant indirect tax reforms in India, effectively consolidating the nation into a unified market. The GST collections on a state-by-state basis provide insights into economic activities, consumption trends, and industrial capabilities across various regions.
The most recent data for the fiscal year 2023-24 unveils some intriguing patterns.
| Rank | State / UT | GST Collection (₹ crore) |
|---|---|---|
| 1 | Maharashtra | ~81,100 |
| 2 | Uttar Pradesh | ~76,649 |
| 3 | Gujarat | ~64,002 |
| 4 | West Bengal | ~41,976 |
| 5 | Rajasthan | ~39,140 |
| 6 | Delhi (UT) | ~32,165 |
| 7 | Madhya Pradesh | ~33,800 |
| 8 | Haryana | ~34,901 |
| 9 | Bihar | ~27,622 |
| 10 | Odisha | ~24,942 |
| 11 | Punjab | ~22,106 |
| 12 | Assam | ~14,691 |
| 13 | Chhattisgarh | ~13,895 |
| 14 | Jharkhand | ~12,456 |
| 15 | Tamil Nadu | ~11,017 |
| 16 | Karnataka | ~13,014 |
| 17 | Telangana | ~5,399 |
| 18 | Uttarakhand | ~8,403 |
| 19 | Jammu & Kashmir (UT) | ~8,093 |
| 20 | Himachal Pradesh | ~5,584 |
| 21 | Andhra Pradesh | ~4,082 |
| 22 | Kerala | ~2,598 |
| 23 | Tripura | ~1,583 |
| 24 | Meghalaya | ~1,713 |
| 25 | Arunachal Pradesh | ~1,902 |
| 26 | Manipur | ~1,095 |
| 27 | Nagaland | ~1,057 |
| 28 | Mizoram | ~963 |
| 29 | Sikkim | ~951 |
| 30 | Goa | ~565 |
| 31 | Dadra & Nagar Haveli & Daman & Diu (UT) | ~661 |
| 32 | Puducherry (UT) | ~221 |
| 33 | Andaman & Nicobar Islands (UT) | ~32 |
| 34 | Ladakh (UT) | ~41 |
| 35 | Chandigarh (UT) | 1342 |
| 36 | Lakshadweep (UT) | ~2 |
Leading Contributors
Maharashtra tops the list with an impressive GST collection of approximately ₹81,100 crore. Given its status as India’s financial and industrial hub, this is hardly unexpected—Mumbai alone contributes a substantial portion through its services, trade, and manufacturing sectors.
Following closely is Uttar Pradesh with ₹76,649 crore, which highlights its expanding consumption base along with its growing industrial and logistics sectors. Gujarat, recognized as another industrial powerhouse, ranks third with ₹64,002 crore, bolstered by its robust manufacturing and export framework.
West Bengal (₹41,976 crore) and Rajasthan (₹39,140 crore) round out the top five, showcasing strong performances in trade, agriculture, and small-scale industries.
Unexpected High Performers
Delhi, with a collection of ₹32,165 crore, ranks sixth despite its relatively small geographical area, underscoring its role as a significant hub for services and trade. Additionally, states like Madhya Pradesh (₹33,800 crore) and Haryana (₹34,901 crore) demonstrate commendable performance, supported by their strong contributions from agriculture, manufacturing, and services.
Middle-Tier Contributors
States such as Bihar (₹27,622 crore), Odisha (₹24,942 crore), and Punjab (₹22,106 crore) reflect a balanced growth trajectory in agriculture, trade, and local industries. Assam (₹14,691 crore) distinguishes itself in the Northeast, illustrating the positive effects of enhancements in infrastructure and connectivity.
Smaller States and Union Territories
Among the smaller states, the collection amounts vary significantly, with Tripura generating ₹1,583 crore and Goa contributing ₹565 crore. In contrast, Union Territories such as Dadra & Nagar Haveli & Daman & Diu, with a collection of ₹661 crore, and Puducherry, at ₹221 crore, illustrate their relatively minor economic impact.
Lakshadweep, with a mere ₹2 crore, ranks at the lowest end, which is anticipated given its small population and limited commercial activities.
Key Observations
- Economic powerhouses are predominant: Maharashtra, Uttar Pradesh, and Gujarat collectively represent a substantial portion of total collections.
- Service hubs perform exceptionally: The significant collection from Delhi, despite its status as a Union Territory, emphasizes the robustness of the services sector.
- Balanced regional growth is evident: Even states with traditionally lower GDPs, such as Bihar and Assam, are demonstrating strong collection figures, indicating a rise in consumption and formal economic activities.
Conclusion
The data on GST collections not only underscores the economic strengths of various states but also reveals changes in consumption and industrial trends. Monitoring these developments is crucial for comprehending the evolution of India's economy and for pinpointing new avenues for growth.