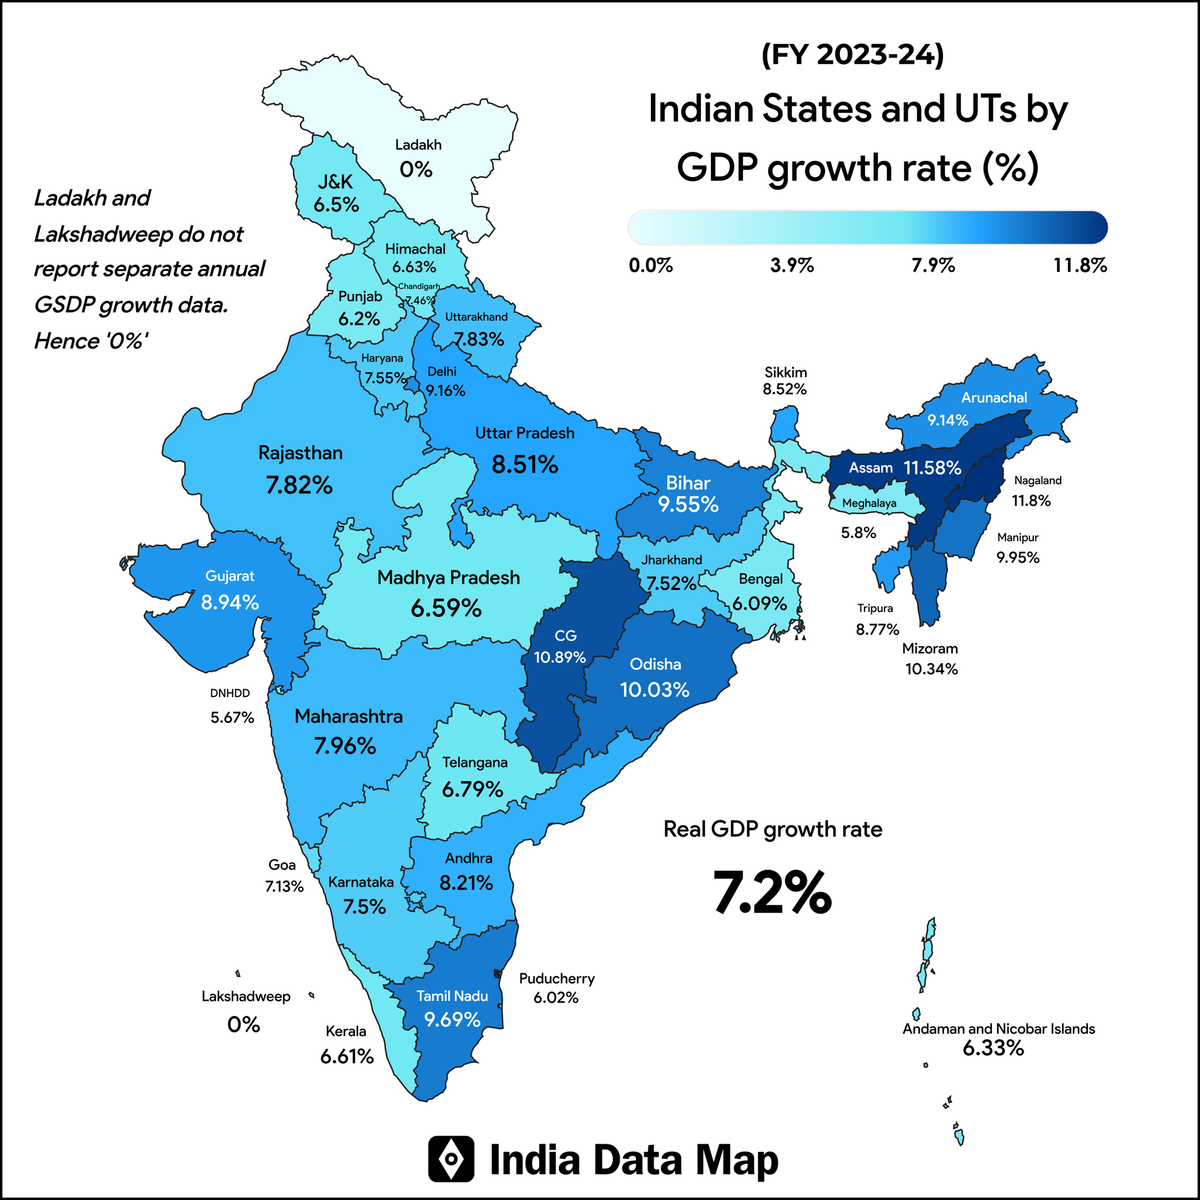
Map: Indian States by GSDP Growth rate (FY 2023-24)
Explore India’s states ranked by GSDP growth rate in 2023-24. See which states are leading, surprising trends, and key economic insights.
India's states and union territories exhibit immense economic heterogeneity, spanning a continental panorama of business scales and degrees of dynamism. The GSDP (Gross State Domestic Product) growth rates show how swiftly the economies of states are expanding and, in doing so, display their development, regional strength, and efficacy of policy implementation.
| Rank | State / UT | GSDP Growth Rate (%) |
|---|---|---|
| 1 | Nagaland | 11.80 |
| 2 | Assam | 11.58 |
| 3 | Chhattisgarh | 10.89 |
| 4 | Mizoram | 10.34 |
| 5 | Odisha | 10.03 |
| 6 | Manipur | 9.95 |
| 7 | Tamil Nadu | 9.69 |
| 8 | Bihar | 9.55 |
| 9 | Gujarat | 8.94 |
| 10 | Tripura | 8.77 |
| 11 | Sikkim | 8.52 |
| 12 | Uttar Pradesh | 8.51 |
| 13 | Uttarakhand | 7.83 |
| 14 | Rajasthan | 7.82 |
| 15 | Maharashtra | 7.96 |
| 16 | Andhra Pradesh | 8.21 |
| 17 | Jharkhand | 7.52 |
| 18 | Haryana | 7.55 |
| 19 | Karnataka | ~7.50 |
| 20 | Chandigarh (UT) | 7.46 |
| 21 | Goa | 7.13 |
| 22 | Arunachal Pradesh | 9.14 |
| 23 | Delhi (UT) | 9.16 |
| 24 | Telangana | 6.79 |
| 25 | Himachal Pradesh | 6.63 |
| 26 | Kerala | 6.61 |
| 27 | Madhya Pradesh | 6.59 |
| 28 | Jammu & Kashmir (UT) | ~6.50 |
| 29 | Andaman & Nicobar Islands (UT) | 6.33 |
| 30 | Punjab | 6.20 |
| 31 | West Bengal | 6.09 |
| 32 | Puducherry (UT) | 6.02 |
| 33 | Meghalaya | 5.80 |
| 34 | Dadra & Nagar Haveli & Daman & Diu (UT) | ~5.67 |
| 35 | Ladakh (UT) | Not Reported |
| 36 | Lakshadweep (UT) | Not Reported |
Standout Performers
Nagaland leads the list with the highest growth rate of 11.80%, closely followed by Assam at 11.58%, indicating the new economic dynamism of the Northeast. Chhattisgarh (10.89%), Mizoram (10.34%), and Odisha (10.03%) are also on the list with a prevalence of industrial and mining activities and more robust state-level policies.
High-Growth Surprises
Manipur (9.95%), Tamil Nadu (9.69%), and Bihar (9.55%) continue to outshine expectations. The growth of Tamil Nadu affirms its diversified base across manufacturing, electronics, and services. Bihar's high growth rate bodes well for its recovery and agricultural gains despite being classified as low per capita income.
Major Economic Hubs Keep Pace
Gujarat (8.94%), Maharashtra (7.96%), Uttar Pradesh (8.51%), and Andhra Pradesh (8.21%) are producing solid growth rates, showing that major industrial and agricultural states can still witness healthy growth rates.
Moderate and Steady
Then we have states like Rajasthan and Uttarakhand, Haryana, Jharkhand, and Karnataka, which demonstrate steady growth in the 7-8% range, presenting a fine picture of balanced performance in agriculture, manufacturing, and services.
Lagging States
Following that, going downward, states and UTs such as West Bengal (6.09%), Punjab (6.20%), Puducherry (6.02%), Dadra & Nagar Haveli & Daman & Diu (~5.67%), etc., have relatively modest growth rates, leaving some scope for policy and industrial push.
Key Observations
- Northeast shines: Multiple Northeastern states sit top among performers, signaling catch-up with the economy and better infrastructure spending.
- Keeping the big boys strong: Gujarat, Tamil Nadu, and Uttar Pradesh continue their strong profits and act as economic engines.
- Trend variety: Smaller states sometimes pull ahead of the bigger, more developed ones, highlighting localized opportunities.
Conclusion
These growth figures tell a mighty story about India's rich economic diversity and potential. Larger states continue to hold the national economy in their arms, while smaller states now usher in regional transformations and hence, are protagonists in India's economic ascendancy.