Map: Indian States by Government Spending per Person (FY 2023-24)
Discover Indian states ranked by government spending per person, revealing stark regional disparities and focused investments in smaller UTs.
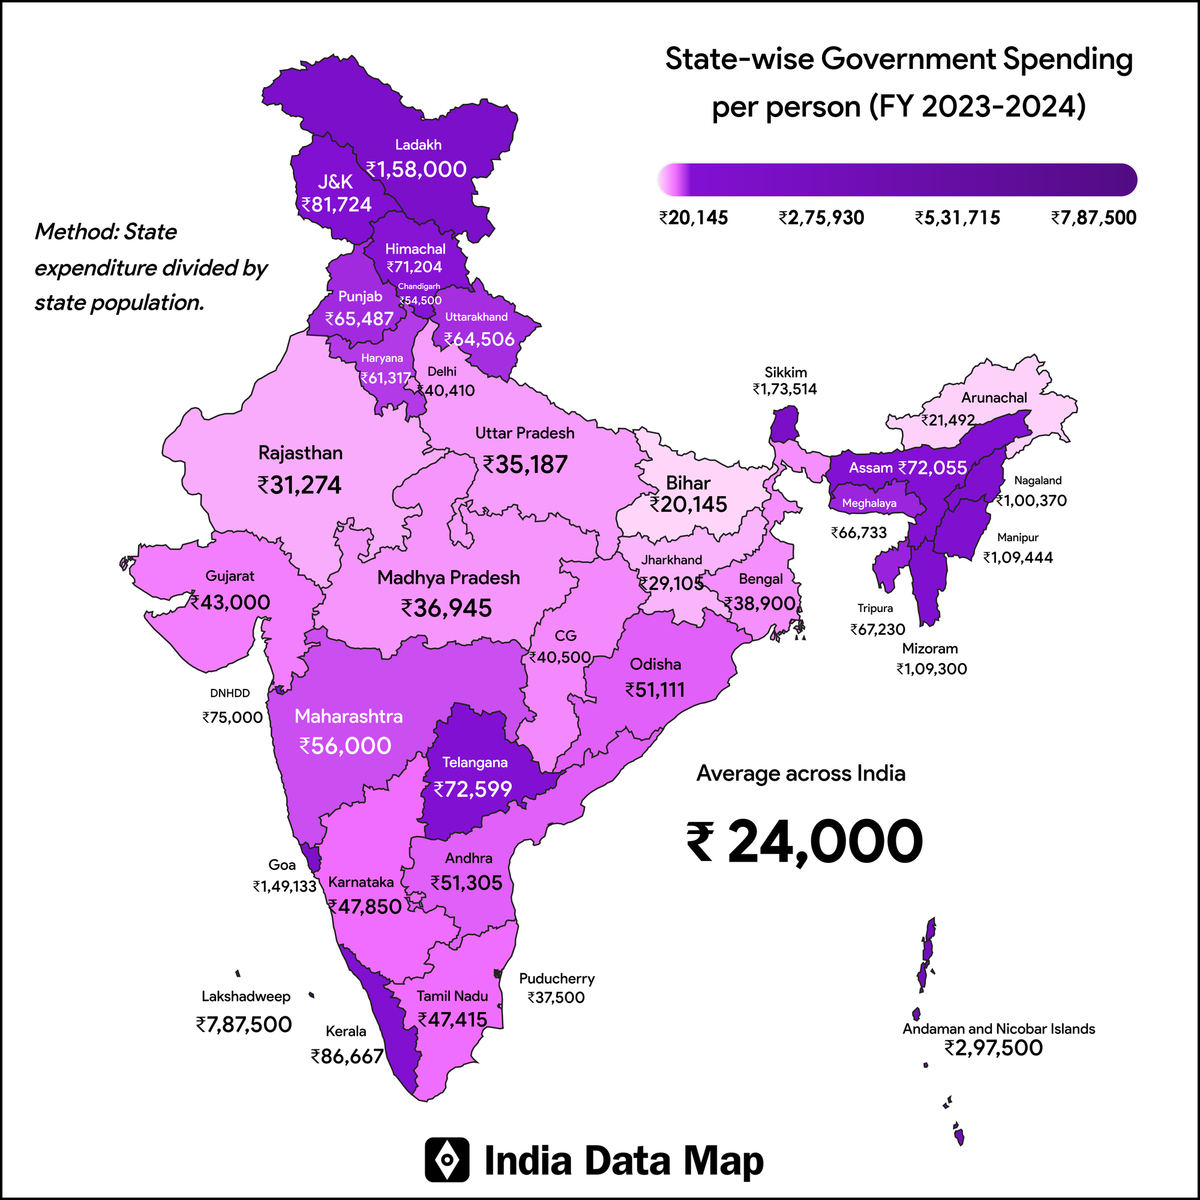
Government expenditure per capita serves as a crucial metric for understanding resource distribution and the level of public investment across various regions. Recent statistics unveil significant disparities among the states and Union Territories (UTs) of India, reflecting differing priorities, demographic sizes, and developmental requirements.
| Rank | Region | Spending per Person (₹) |
|---|---|---|
| 1 | Lakshadweep (UT) | 787,500 |
| 2 | Andaman & Nicobar Islands (UT) | 297,500 |
| 3 | DNHDD (UT) | 158,000 |
| 4 | Sikkim | 173,514 |
| 5 | Goa | 149,133 |
| 6 | Manipur | 109,444 |
| 7 | Mizoram | 109,300 |
| 8 | Nagaland | 100,370 |
| 9 | Kerala | 86,667 |
| 10 | Jammu & Kashmir | 81,724 |
| 11 | Ladakh (UT) | 75,000 |
| 12 | Telangana | 72,599 |
| 13 | Assam (estimate) | 72,055 |
| 14 | Himachal Pradesh | 71,204 |
| 15 | Tripura | 67,230 |
| 16 | Meghalaya | 66,733 |
| 17 | Punjab | 65,487 |
| 18 | Uttarakhand | 64,506 |
| 19 | Haryana | 61,317 |
| 20 | Maharashtra (estimate) | 56,000 |
| 21 | Chandigarh (UT) | 54,500 |
| 22 | Andhra Pradesh | 51,305 |
| 23 | Odisha | 51,111 |
| 24 | Karnataka | 47,850 |
| 25 | Tamil Nadu | 47,415 |
| 26 | Gujarat | 43,000 |
| 27 | Delhi (UT) | 40,410 |
| 28 | Chhattisgarh | 40,500 |
| 29 | West Bengal (estimate) | 38,900 |
| 30 | Puducherry (UT) | 37,500 |
| 31 | Madhya Pradesh | 36,945 |
| 32 | Uttar Pradesh | 35,187 |
| 33 | Rajasthan | 31,274 |
| 34 | Jharkhand | 29,105 |
| 35 | Arunachal Pradesh | 21,492 |
| 36 | Bihar | 20,145 |
UTs Lead the Pack with High Per Capita Spending
Lakshadweep ranks first with an impressive ₹787,500 allocated per individual, followed by the Andaman & Nicobar Islands at ₹297,500. These smaller UTs benefit from considerably higher per capita expenditures due to their smaller populations and strategic significance. Likewise, Dadra & Nagar Haveli & Daman & Diu (DNHDD) and Sikkim report per capita spending of ₹158,000 and ₹173,514, respectively, indicating a concentrated allocation of resources in these smaller areas.
Northeastern States and Jammu & Kashmir See Elevated Spending
A number of northeastern states, including Manipur (₹109,444), Mizoram (₹109,300), Nagaland (₹100,370), and Meghalaya (₹66,733), exhibit notable government spending per capita. Jammu & Kashmir (₹81,724) and Ladakh (₹75,000) also demonstrate considerable expenditures, likely associated with infrastructure development and welfare initiatives in challenging geographical conditions.
Larger States Show Moderate Per Person Spending
States such as Telangana (₹72,599), Kerala (₹86,667), and Punjab (₹65,487) reflect reasonable per capita spending when compared to larger states. Maharashtra, recognized as India’s economic hub, shows an estimated expenditure of ₹56,000 per person, while Uttar Pradesh and Bihar—two of the most populous states—report significantly lower spending at ₹35,187 and ₹20,145, respectively, highlighting the difficulties in equitable resource distribution.
The Developmental Divide
A distinct developmental divide is evident, where smaller or strategically significant regions receive greater per capita investments, while densely populated states encounter the challenge of distributing resources more thinly. This trend underscores the necessity for targeted policies aimed at fostering balanced growth without undermining essential services in high-population areas.
Key Insight
Although individual spending differs significantly, the data highlights the government's commitment to enhancing smaller Union Territories and northeastern states via targeted investment. In contrast, for larger states, the effective use of allocated resources is crucial for meeting the demands of their extensive populations.