Map: Indian States by GDP per Capita (FY 2023-24)
Explore India's states ranked by GDP per capita in 2023-24. See which regions are richest and key insights into economic disparities.
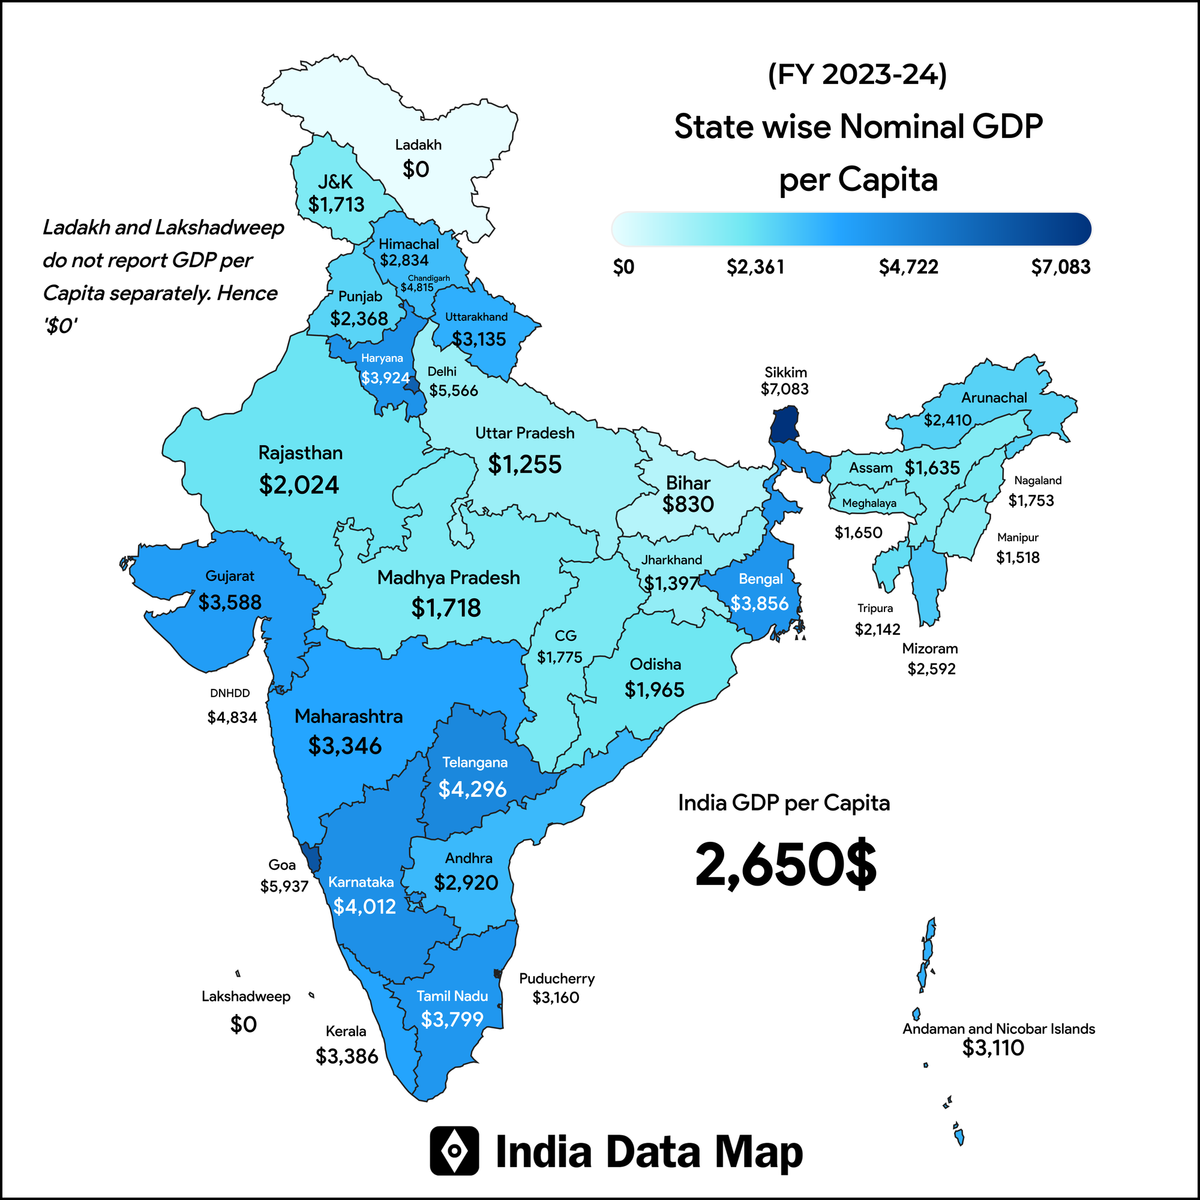
India's economic narrative extends beyond its overall GDP; it also encompasses the average income generated by each individual. GDP per capita provides a more precise understanding of regional wealth and living standards. The most recent data for 2023-24 indicates significant disparities among states and union territories.
| Rank | State / UT | GDP per Capita (₹) | GDP per Capita (USD) |
|---|---|---|---|
| 1 | Sikkim | 587,743 | $7,083 |
| 2 | Goa | 492,648 | $5,937 |
| 3 | Delhi (UT) | 461,910 | $5,566 |
| 4 | Dadra & Nagar Haveli & Daman & Diu (UT) | — | $4,834 |
| 5 | Chandigarh (UT) | 399,654 | $4,815 |
| 6 | Telangana | 356,564 | $4,296 |
| 7 | Karnataka | 332,926 | $4,012 |
| 8 | Haryana | 325,759 | $3,924 |
| 9 | Tamil Nadu | 315,220 | $3,799 |
| 10 | Gujarat | 297,722 | $3,588 |
| 11 | Kerala | 281,001 | $3,386 |
| 12 | Maharashtra | 277,603 | $3,346 |
| 13 | Puducherry (UT) | 262,166 | $3,160 |
| 14 | Uttarakhand | 260,201 | $3,135 |
| 15 | Andaman & Nicobar Islands (UT) | 258,151 | $3,110 |
| 16 | Andhra Pradesh | 242,479 | $2,920 |
| 17 | Himachal Pradesh | 235,199 | $2,834 |
| 18 | Mizoram | 215,144 | $2,592 |
| 19 | Arunachal Pradesh | 199,992 | $2,410 |
| 20 | Punjab | 196,505 | $2,368 |
| 21 | Tripura | 177,723 | $2,142 |
| 22 | Rajasthan | 167,964 | $2,024 |
| 23 | Odisha | 163,101 | $1,965 |
| 24 | West Bengal | 154,119 | $1,856 |
| 25 | Nagaland | 145,537 | $1,753 |
| 26 | Madhya Pradesh | 142,565 | $1,718 |
| 27 | Jammu & Kashmir (UT) | 142,138 | $1,713 |
| 28 | Meghalaya | 136,948 | $1,650 |
| 29 | Assam | 135,787 | $1,635 |
| 30 | Manipur | 125,937 | $1,518 |
| 31 | Jharkhand | 115,960 | $1,397 |
| 32 | Uttar Pradesh | 104,126 | $1,255 |
| 33 | Bihar | 68,828 | $830 |
| 34 | Ladakh (UT) | — | — |
| 35 | Lakshadweep (UT) | — | — |
The Leaders
Sikkim tops the rankings with an impressive per capita GDP of $7,083. Despite its small size as a northeastern state, Sikkim's emphasis on hydropower, organic agriculture, and tourism has enabled it to achieve this status.
Following closely is Goa, with a per capita GDP of $5,937, attributed to its robust tourism sector and substantial contributions from the service industry.
Delhi, the capital of India and a center for services, ranks third with a per capita GDP of $5,566, showcasing its strong economic foundation in information technology, trade, and finance.
Smaller regions such as Dadra & Nagar Haveli & Daman & Diu ($4,834) and Chandigarh ($4,815) also demonstrate strong performance, benefiting from industrial clusters and elevated urban incomes.
High-Performing States
Telangana ($4,296), Karnataka ($4,012), and Haryana ($3,924) exemplify the economic prowess of southern and northern industrial hubs. These states excel in information technology, manufacturing, and services, contributing to greater individual wealth.
Tamil Nadu ($3,799) and Gujarat ($3,588) continue to showcase their well-rounded industrial and manufacturing capabilities.
Middle Segment
States such as Kerala ($3,386), Maharashtra ($3,346), and Puducherry ($3,160) constitute the middle tier. While Maharashtra remains the largest contributor to India's overall GDP, its extensive population diminishes its per capita figure.
States Lagging Behind
At the lower end of the spectrum, states like Bihar ($830), Uttar Pradesh ($1,255), and Jharkhand ($1,397) underscore the difficulties posed by high population densities and sluggish industrial development.
In a similar vein, northeastern states such as Manipur ($1,518) and Assam ($1,635) encounter structural challenges and limited industrial growth.
Key Insights
Smaller entities can exhibit greater wealth: Smaller states and Union Territories with specialized industries or urban economies frequently display a higher per capita GDP.
Southern states excel: Karnataka, Telangana, and Tamil Nadu persist in showcasing robust growth driven by the IT and services sectors.
Income disparities remain significant: Bihar’s per capita GDP is almost eight times less than that of Sikkim, underscoring pronounced regional inequality.
Conclusion
Although India is experiencing overall growth, the per capita GDP landscape reveals a narrative of varied advancement and significant inequality. Grasping these disparities is essential for implementing targeted policy measures and fostering equitable regional development.