Map: Indian States by Gross State Domestic Product (FY 2023-24)
Indian states ranked by GSDP in 2023-24. See top economic performers, key trends, and surprising insights in one detailed overview.
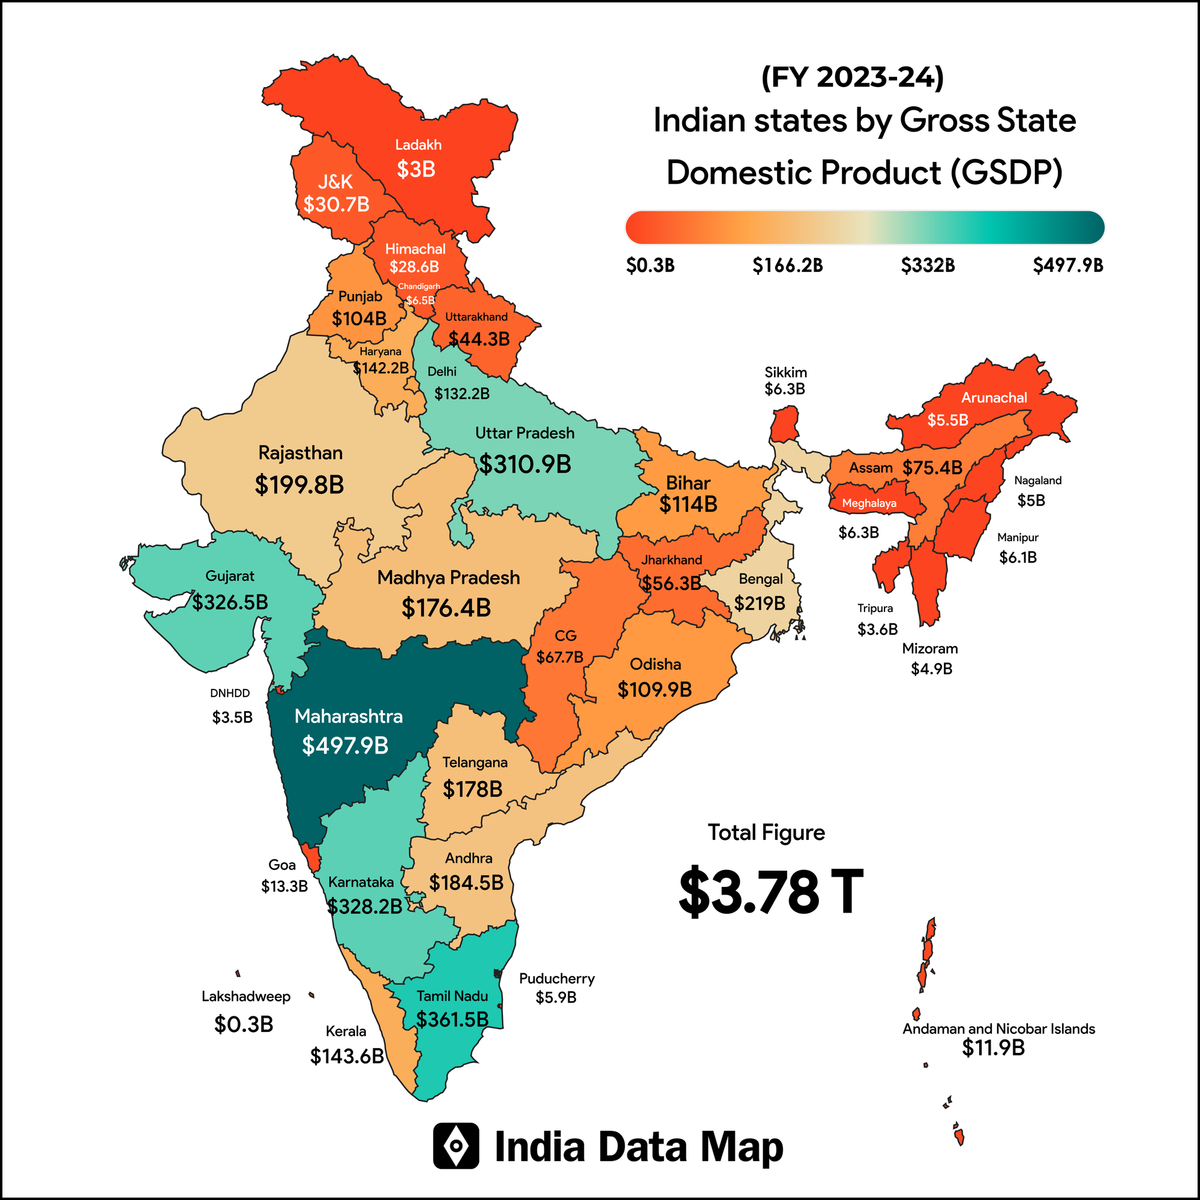
India's economic strength is deeply rooted in its states and union territories, each contributing uniquely to the nation's overall GDP. The Gross State Domestic Product (GSDP) is a crucial indicator showing how each region drives economic growth, attracts investment, and supports local livelihoods.
| Rank | State / UT | GDP (USD Billion) |
|---|---|---|
| 1 | Maharashtra | 497.9 |
| 2 | Tamil Nadu | 361.5 |
| 3 | Karnataka | 328.2 |
| 4 | Gujarat | 326.5 |
| 5 | Uttar Pradesh | 310.9 |
| 6 | West Bengal | 219.0 |
| 7 | Rajasthan | 199.8 |
| 8 | Andhra Pradesh | 184.5 |
| 9 | Telangana | 178.0 |
| 10 | Madhya Pradesh | 176.4 |
| 11 | Kerala | 143.6 |
| 12 | Haryana | 142.2 |
| 13 | Delhi (UT) | 132.2 |
| 14 | Bihar | 114.0 |
| 15 | Odisha | 109.9 |
| 16 | Punjab | 104.0 |
| 17 | Assam | 75.4 |
| 18 | Chhattisgarh | 67.7 |
| 19 | Jharkhand | 56.3 |
| 20 | Uttarakhand | 44.3 |
| 21 | Jammu & Kashmir (UT) | 30.7 |
| 22 | Himachal Pradesh | 28.6 |
| 23 | Goa | 13.3 |
| 24 | Andaman & Nicobar Is. | 11.9 |
| 25 | Chandigarh | 6.5 |
| 26 | Sikkim | 6.3 |
| 27 | Meghalaya | 6.3 |
| 28 | Manipur | 6.1 |
| 29 | Nagaland | 5.0 |
| 30 | Mizoram | 4.9 |
| 31 | Tripura | 3.6 |
The Economic Powerhouses
Maharashtra tops the list with an estimated GSDP of USD 498 billion, reinforcing its position as India’s financial and industrial hub. Tamil Nadu and Karnataka follow, contributing USD 362 billion and USD 328 billion respectively, highlighting their strong manufacturing, IT, and services sectors.
Gujarat (USD 327 billion) and Uttar Pradesh (USD 311 billion) round out the top five. Gujarat's dominance in manufacturing and exports and Uttar Pradesh’s expanding industrial and agricultural base make them major economic engines.
Rising Contributors
West Bengal (USD 219 billion) and Rajasthan (USD 200 billion) illustrate strong growth in agriculture, mining, and services. Southern states like Andhra Pradesh (USD 185 billion) and Telangana (USD 178 billion) showcase rapid infrastructure growth and robust tech-driven economies.
Madhya Pradesh (USD 176 billion), Kerala (USD 144 billion), and Haryana (USD 142 billion) also stand out, each driven by a mix of agriculture, industry, and services.
Smaller Yet Significant
States like Goa (USD 13 billion), Sikkim (USD 6.3 billion), and northeastern states such as Manipur, Mizoram, and Nagaland have smaller absolute GSDPs but play a vital role in regional balance and cultural diversity. Union Territories like Delhi (USD 132 billion) and Andaman & Nicobar Islands (USD 12 billion) show how even smaller regions can contribute meaningfully, especially through tourism, services, and governance-driven economies.
Key Observations
- Southern strength: Four of the top ten economies are from southern India, reflecting their balanced growth in IT, manufacturing, and services.
- Industrial hubs lead: States with strong industrial bases—Maharashtra, Gujarat, Tamil Nadu—consistently dominate.
- Urban-driven economies: Delhi and Chandigarh, despite their small geographic sizes, maintain high GSDPs due to dense economic activities and services.
- Diverse regional stories: From agriculture-driven Bihar (USD 114 billion) to the tourism-led economy of Goa, each state has a unique growth narrative.
Conclusion
The GSDP data highlights India’s diverse and dynamic economic landscape. While larger states continue to drive overall national growth, smaller states and UTs play a critical role in ensuring inclusivity and balanced development.
Sources
- Reserve Bank of India — Handbook of Statistics on Indian States - https://www.rbi.org.in/Scripts/PublicationsView.aspx?id=20349
- Economic Survey of India 2023-24 - https://www.indiabudget.gov.in/economicsurvey/
- Statista — Indian States GSDP Statistics - https://www.statista.com/statistics/1075169/india-gross-state-domestic-product-by-state/